I’m blogging about the development of a new product in Mozilla, look here for my other posts in this series
We’re in the process of reviewing the KPI (Key Performance Indicators) for Firefox Hello (relatedly I joined the Firefox Hello team as engineering manager in October). Mozilla is trying (like everyone else) to make data-driven decisions. Basing decisions on data has some potential to remove or at least reveal bias. It provides a feedback mechanism that can provide continuity even as there are personnel changes. It provides some accountability over time. Data might also provide insight about product opportunities which we might otherwise miss.
Enter the KPI: for Hello (like most products) the key performance indicators are number of users, growth in users over time, user retention, and user sentiment (e.g., we use the Net Promoter Score). But like most projects those are not actually our success criteria: product engagement is necessary but not sufficient for organizational goals. Real goals might be revenue, social or political impact, or improvement in brand sentiment.
The value of KPI is often summarized as “letting us know how we’re doing”. I think the value KPI offers is more select:
- When you think a product is doing well, but it’s not, KPI is revealing.
- When you know a product isn’t doing well, KPI let’s you triage: is it hopeless? Do we need to make significant changes? Do we need to maintain our approach but try harder?
- When a product is doing well the KPI gives you a sense of the potential. You can also triage success: Should we invest heavily? Stay the path? Is there no potential to scale the success far enough?
I’m skeptical that KPI can provide the inverse of 1: when you think a product is doing poorly, can KPI reveal that it is doing well? Because there’s another set of criteria that defines “success”, KPI is necessary but not sufficient. It requires a carefully objective executive to revise their negative opinion about the potential of a project based on KPI, and they may have reasonably lost faith that a project’s KPI-defined success can translate into success given organizational goals.
The other theoretical value of KPI is that you could correlate KPI with changes to the product, testing whether each change improves your product’s core value. I’m sure people manage to do this, with both very fine grained measurements and fine grained deployments of changes. But it seems more likely to me that for most projects given a change in KPI you’ll simply have to say “yup” and come up with unverified theories about that change.
The metrics that actually support the development of the product are not “key”, they are “incidental”. These are metrics that find bugs in the product design, hint at unexplored opportunities, confirm the small wins. These are metrics that are actionable by the people making the product: how do people interact with the tool? What do they use it for? Where do they get lost? What paths lead to greater engagement?
What is KPI for?
I’m trying to think more consciously about the difference between managing up and managing down. A softer way of phrasing this is managing in and managing out – but in this case I think the power dynamics are worth highlighting.
KPI is data that goes up. It lets someone outside the project – and above the project – make choices: about investment, redirection, cancellation. KPI data doesn’t go down, it does little to help the people doing the work. Feeling joy or despair about your project based on KPI is not actionable for those people on the inside of a project.
Incentive or support
I would also distinguish two kinds of management here: one perspective on management is that the organization should set up the right incentives and consequences so that rewards are aligned with organizational goals. The right incentives might make people adapt their behavior to get alignment; how they adapt is undefined. The right incentives might also exclude those who aren’t in alignment, culling misalignment from the organization. Another perspective is that the organization should work to support people, that misalignment of purpose between a person and the organization is more likely a bug than a misalignment of intention. Are people black boxes that we can nudge via punishment and reward? Are there less mechanical ways to influence change?
Student performance measurement are another kind of KPI. It lets someone on the outside (of the classroom) know if things are going well or poorly for the students. It says little about why, and it doesn’t support improvement. School reform based on measurement presumes that teachers and schools are able to achieve the desired outcomes, but simply not willing. A risk of top-down reform: the people on the top use a perspective from the top. As an authority figure, how do I make decisions? The resulting reform is disempowering, supporting decisions from above, as opposed to using data to support the empowerment of those making the many day-to-day decisions that might effect a positive outcome.
Of course, having data available to inform decisions at all levels – from the executive to the implementor – would be great. But there’s a better criteria for data: it should support decision making processes. What are your most important decisions?
As an example from Mozilla, we have data about how much Firefox is used and its marketshare. How much should we pay attention to this data? We certainly don’t have the granularity to connect changes in this KPI to individual changes we make in the project. The only real way to do that is through controlled experiments (which we are trying). We aren’t really willing to triage the project; no one is asking “should we just give up on Firefox?” The only real choice we can make is: are we investing enough in Firefox, or should we invest more? That’s a question worth asking, but we need to keep our attention on the question and not the data. For instance, if we decide to increase investment in Firefox, the immediate questions are: what kind of investment? Over what timescale? Data can be helpful to answer those questions, but not just any data.
Exploratory data
Weeks after I wrote (but didn’t publish) this post I encountered Why Greatness Cannot Be Planned: The Myth of the Objective, a presentation by Kenneth Stanley:
“Setting an objective can block its own achievement. It can be an obstacle to creativity and innovation in general. Without protection of individual autonomy collaboration can become dangerously objective.”
The example he uses is manually searching a space of nonlinear image generation to find interesting images. The positive example is one where people explore, branching from novel examples until something recognizable emerges:

One negative example is one where an algorithm explores with a goal in mind:
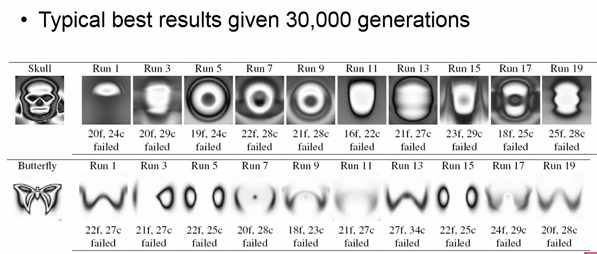
Another negative example is selection by voting, instead of personal exploration; a product of convergent consensus instead of divergent treasure hunting:

If you decide what you are looking for, you are unlikely to find it. This generated image search space is deliberately nonlinear, so it’s difficult to understand how actions affect outcomes. Though artificial, I think the example is still valid: in a competitive environment, the thing you are searching for is hard to find, because if it was not hard then someone would have found it. And it’s probably hard because actions affect outcomes in unexpected ways.
You could describe this observation as another way of describing the pitfalls of hill climbing: getting stuck at local maximums. Maybe an easy fix is to add a little randomness, to bounce around, to see what lies past the hill you’ve found. But the hills themselves can be distractions: each hill supposes a measurement. The divergent search doesn’t just reveal novel solutions, but it can reveal a novel rubric for success.
This is also a similar observation to that in Innovator’s Dilemma: specifically that in these cases good management consistently and deliberately keeps a company away from novelty and onto the established track, and it does so by paying attention to the feedback that defines the company’s (current) success. The disruptive innovation, a term somewhat synonymous with the book, is an innovation that requires a change in metrics, and that a large portion of the innovation is finding the metric (and so finding the market), not implementing the maximizing solution.
But I digress from the topic of data. If we’re going to be data driven to entirely new directions, we may need data that doesn’t answer a question, doesn’t support a decision, but just tells us about things we don’t know. To support exploration, not based on a hypothesis which we confirm or reject based on the data, because we are still trying to discover our hypothesis. We use the data to look for the hidden variable, the unsolved need, the desire that has not been articulated.
I think we look for this kind of data more often than we would admit. Why else would we want complex visualizations? The visualizations are our attempt at finding a pattern we don’t expect to find.
In Conclusion
I’m lousy at conclusions. All those words up there are like data, and I’m curious what they mean, but I haven’t figured it out yet.